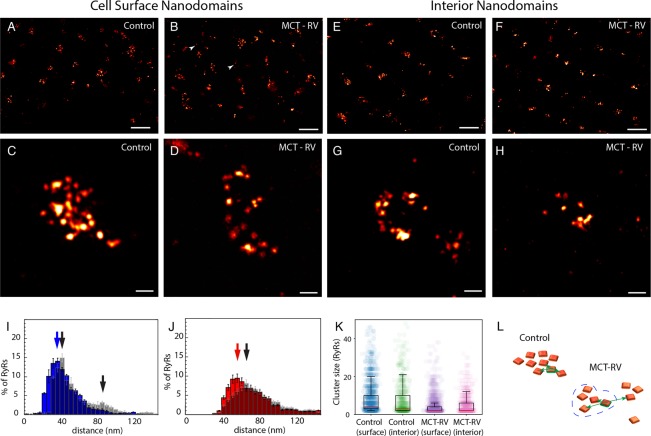
Figure 3.
Adaptation of 10× EExM to visualize nanoscale RyR rearrangement in pathology. Comparison of near-surface RyR organization in right ventricular cardiomyocytes isolated from (A) control and (B) MCT-RV, which featured noticeably more frequent solitary RyR puncta (arrowheads). Magnified views of (C) control and (D) MCT-RV nanodomains at the cell surface revealed a visibly sparse dispersed RyR arrangement within the nanodomain areas. RyR nanodomains in the interior of (E) control cells and (F) MCT-RV cells. Magnified view of (G) RyR nanodomains in control cells featured closely clustered RyRs tracing out their curved topography, which contrasted with (H) regions in MCT-RV cell featuring smaller and less discernible nanodomains. (I) NND histogram of interior nanodomains in MCT-RV cells (gray-shaded) featured a larger mean ± SEM (51.65 ± 4.45 nm), a right-shifted primary maximum at ∼45 nm, and a secondary maximum at ∼85 nm (black arrows) compared to control (blue; mode in blue arrow; mean: 45.41 ± 0.76 nm; p = 0.001, df = 19 cells; Bonferroni-adjusted Mann–Whitney test). (J) Histograms showing a rightward shift in the mode for the 3NDs for MCT-RV RyRs (gray-shaded; black arrow; mean 91.02 ± 12.88 nm) compared to control (red; red arrow; mean: 73.74 ± 14.27 nm; p = 0.0002, df = 19, Bonferroni-adjusted Mann–Whitney test). (K) Dot-plots comparing the cluster size distributions in near-surface and interior nanodomains show a diminished mean and the range of RyR counts in individual clusters in both near-surface (p < 0.0001; df = 20) and interior (p < 0.0001; df = 19) of MCT-RV cells compared to control. (L) Schematic illustrating how cluster fragmentation in MCT-RV may coincide with the increased NND and 3ND (green arrows) for some RyRs. Scale bars: (A, B, E, and F) 1 μm and (C, D, G, and H) 50 nm. Error bars in plots: SD.

