Figure 4.
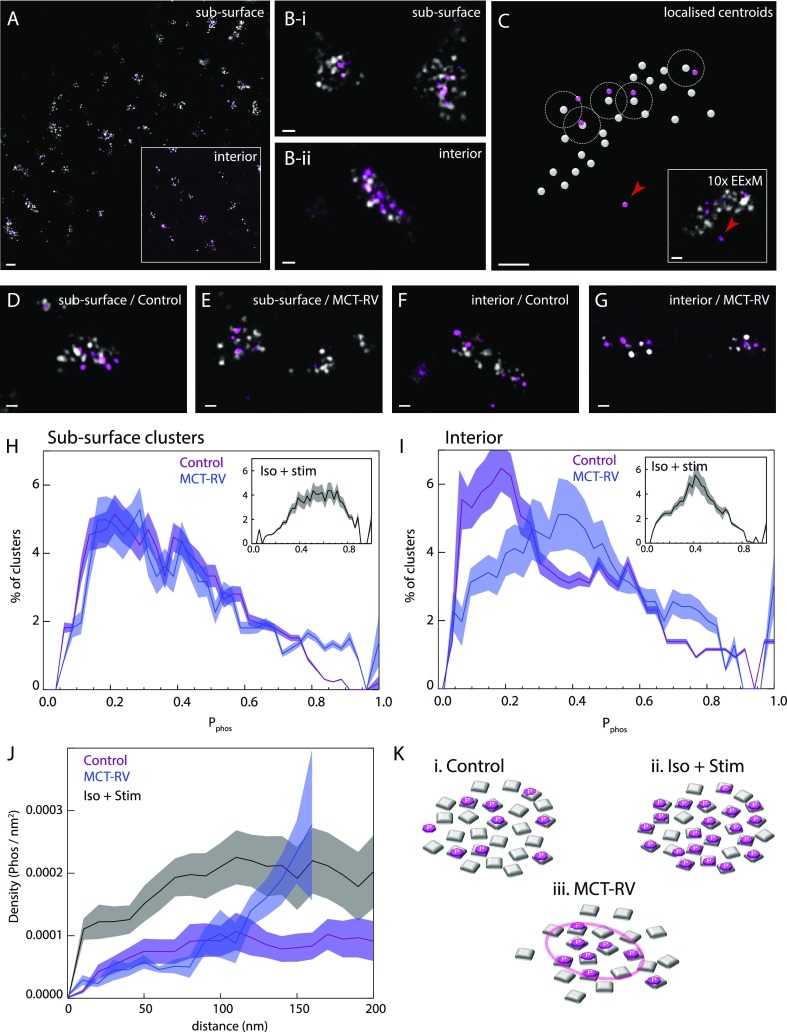
10× EExM visualization of variable phosphorylation of RyRs during pathology and acute stimulation. (A) Overlay of 10× EExM images of RyR (gray) and pS2808 (purple) at the surface of a rat ventricular cardiac myocyte. Inset shows the equivalent view in a region ∼5 μm below the cell surface. (B) Magnified view of nanodomains near (i) the cell surface and (ii) cell interior visually illustrates that punctate pS2808 (purple) labeling densities, observed in fewer numbers, follow either close overlap or proximity with RyR puncta (gray). (C) The centroids of the RyR (gray) and pS2808 puncta (purple) were localized and paired with the nearest RyR within a 30 nm 3D distance (dashed line) to identify RyRs which were phosphorylated at the Ser2808 site. Raw data of region illustrated in inset. An example of unpaired pS2808 marker is shown with an arrowhead. Magnified views of the overlays of subsurface nanodomains in cells from the right ventricles of (D) control and (E) MCT rats show a minor fraction of RyRs which associate pS2808 labeling. The same comparison in the cell interior regions illustrates a similar fraction of RyRs with Ser2808 phosphorylation in (F) control nanodomains, while a greater proportion of RyRs, despite smaller cluster size, coincide with pS2808 labeling in (G) MCT-RV nanodomains. (H) Percentage histograms of the mean fraction of RyRs determined to be phosphorylated at Ser2808 (Pphos) in the subsurface nanodomains containing ≥4 RyRs illustrate near-identical distributions (mean ± SD of Pphos of 0.31 ± 0.10 and 0.30 ± 0.12; p > 0.05; df = 20 cells; Bonferroni-corrected Mann–Whitney t test) for both control (purple) and MCT-RV (blue). (I) Cell interior nanodomains in MCT-RV (blue; 0.45 ± 0.07) showed a rightward shifted Pphos distribution compared to control (purple; 0.27 ± 0.09 ; p = 0.022, df = 19). Pphos distributions for both subsurface and interior nanodomains appeared to show a right-shift in control cells stimulated with isoproterenol and simultaneous electrical pacing at 1 Hz (insets). (J) Histograms of the 2D pS2808 localization density as a function of the distance within the subsurface nanodomain relative to its boundary in control (purple line), stimulated (black), and MCT-RV (blue) cells. (K-i) In control cells, RyRs phosphorylated at Ser2808 are located, on average, uniformly throughout the nanodomain. (K-ii) Stimulation with isoproterenol and electrical pacing appeared to approximately double the pS2808 density uniformly across the nanodomain. (K-iii) In MCT-RV, a gradient of pS2808 density is seen from the edge of the nanodomain inward, allowing a subdomain of potentiated RyRs to be maintained at the center of the nanodomain (circle). Scale bars: (A) 200 nm, (B–G) 50 nm.

