Figure 5.
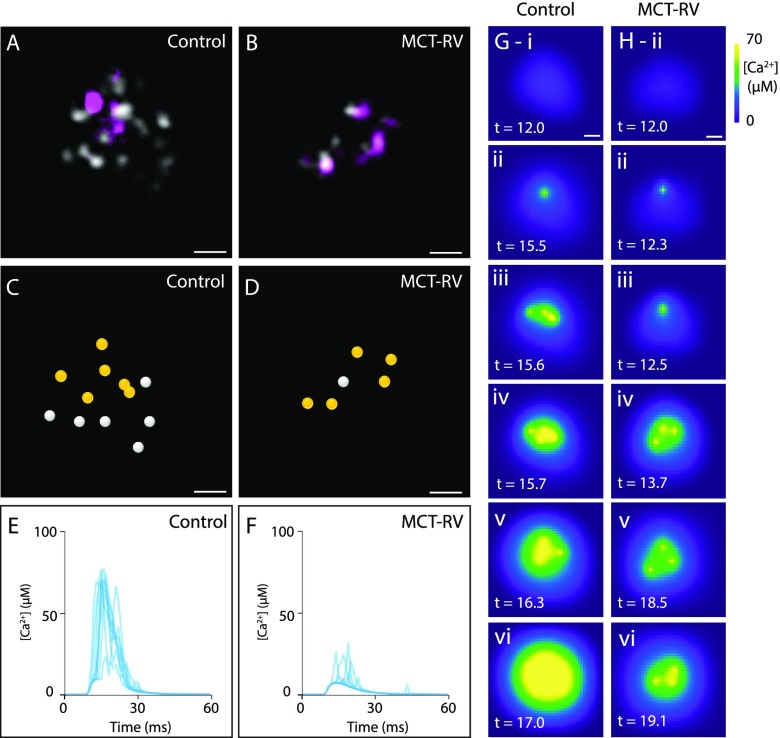
Simulating geometrically realistic spatiotemporal patterns of Ca2+ release based on 10× EExM data. Shown are examples of RyR (gray) and pS2808 (purple) labeling in approximately median-sized nanodomains of control (A) and MCT-RV cells (B). The centroids of the receptors were localized (circles), and receptors identified as phosphorylated were marked (yellow circles) for the control (C) and MCT-RV (D) clusters. A series of local Ca2+ sparks, overplotted as the time course of the local change in cytoplasmic Ca2+ concentration (shown in μM), illustrates how the control (E) geometry facilitates more consistent and pronounced Ca2+ release events compared to that in the MCT-RV cluster (F). Spatiotemporal visualization of the cytoplasmic Ca2+ (color scale shown in μM) at a spatial resolution of 10 nm in the early phases of the Ca2+ sparks illustrates progressive recruitment of RyRs, more readily among those phosphorylated at S2808, in the control nanodomain (G) compared to MCT-RV. The latter shows recruitment of RyR openings, however, often failed to achieve cluster-wide activation in the first 20 ms of the spark. Scale bars: 50 nm. Time stamps in (G and H) shown in ms.

