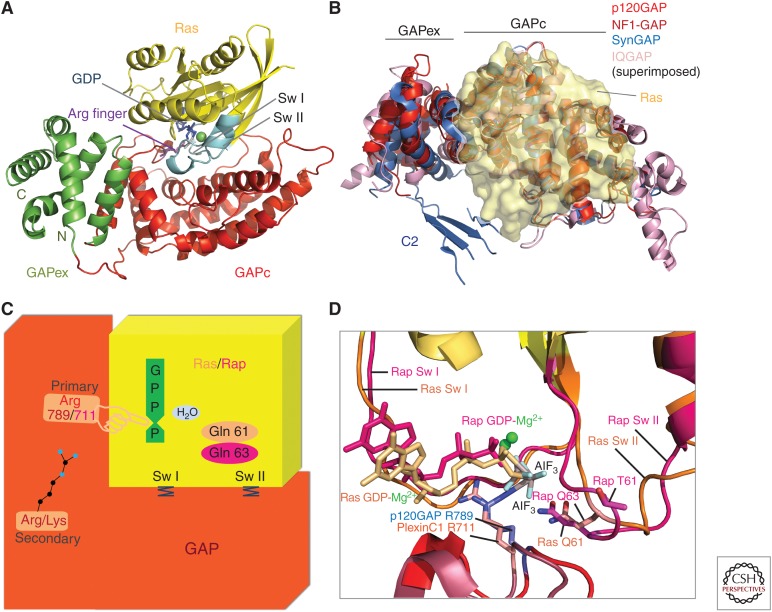
Figure 3.
Ras-specific GTPase-activating protein (RasGAP) structure and mechanism. (A) Ribbon representation of the Ras–RasGAP complex as derived from the structure of the catalytic domain of p120GAP/RASA1 (red and green) bound to Ras (yellow) and GDP-aluminum fluoride (AlF3) (blue) (Scheffzek et al. 1997a), switch regions are shown in cyan, and arginine finger motif in violet. (B) Ribbon representation of different RasGAPs superimposed and modeled onto Ras shown in transparent yellow. View is rotated approximately 90° about a horizontal axis as compared to RasGAP in panel A representing a top view on the modeled complex. C2 domain fragment of SynGAP (blue) appears in proximity of the Ras-binding region in SynGAP. (C) Cartoon representation of the Ras–RasGAP complex including dual-specificity functionalities. Ras/Rap is shown in yellow and GAP in red. Upon binding of Ras/Rap to GAP, the GTPase activity is strongly enhanced by the complementation of the active site, delivering the catalytic arginine, 789 (p120GAP), or 711(PlexinC1). This is further stabilized by interaction with a secondary Arg/Lys in the GAP domain. Glutamine 61 of Ras or Glutamine 63 of Rap contributes to the catalysis reaction by positioning phosphate accepting water molecule for nucleophilic attack. Additional residues and motifs in GAP stabilize the switch I and switch II regions of Ras/Rap, supporting a conformation that is favorable for efficient GTP hydrolysis. (D) Close-up view of the Ras/Rap active site bound to GAP showing conformational concordance or variations in the switch regions on Ras-p120GAP and Rap-PlexinC1GAP. Components of the nucleotide-binding site are shown for Ras (beige) and Rap (pink). The catalytic arginines in PlexinC1GAP and p120GAP are included. (Structural visualizations in panels A, B, and D were done with The PyMOL Molecular Graphics System, Version 1.8 Schrödinger, LLC.)

