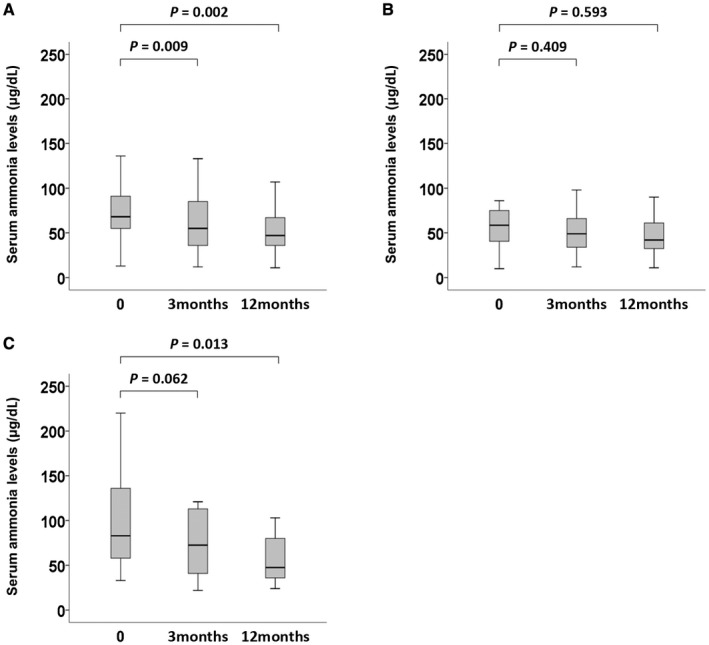
Figure 1.

Effects of L‐carnitine on serum ammonia levels in (A) overall patients (n = 52), (B) the L‐carnitine low‐dose group (n = 26), and (C) the L‐carnitine high‐dose group (n = 26). Box and whisker plots show changes in serum ammonia level at study entry and 3 and 12 months following the start of treatment with L‐carnitine. Data were analyzed by the paired Student t test. In these plots, lines within the boxes represent median values; the upper and lower lines of the boxes represent the 25th and 75th percentiles, respectively.
