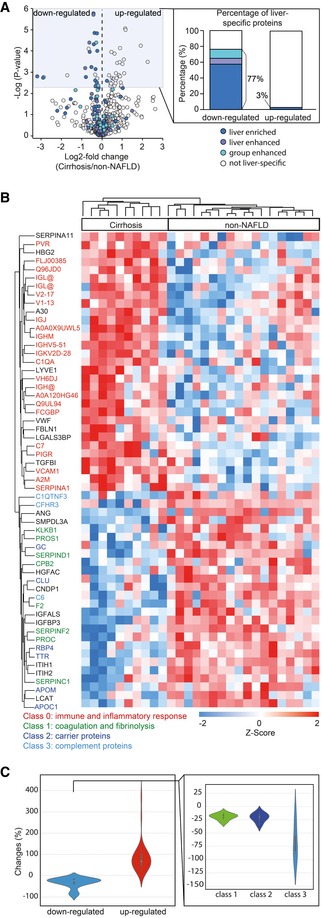
Figure 2. Reduced protein production and increased immunological response in cirrhotic liver.

- Volcano plot of statistical significance against log2‐fold change between the cirrhosis group (N = 10) and non‐NAFLD group (N = 18), showing significantly differentially expressed proteins shaded in blue and down‐regulated liver‐specific proteins color‐coded according to the classification of Human Protein Atlas (HPA). Significance was defined by independent two‐sample t‐test (two‐sided) corrected by permutation‐based FDR of 0.05. The percentage of down‐ and up‐regulated “liver‐specific” proteins is indicated.
- Hierarchical clustering of significantly expressed proteins between the cirrhosis group and non‐NAFLD group. Intensities of proteins were log2‐transformed and Z‐scored to normalize across individuals. Proteins involved in different biological processes or belonging to different classes are indicated by color.
- Violin plot of mean fold changes for down‐ and up‐regulated proteins. The fold changes of down‐regulated proteins were further calculated separately for the three protein classes indicated in panel B.
