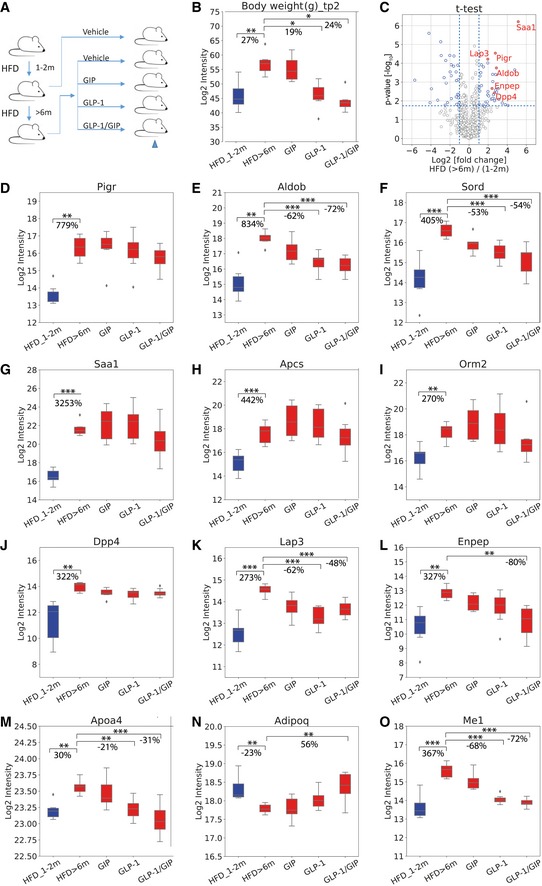
Figure 5. Plasma proteome changes in a HFD‐induced NAFLD mouse model.

-
AMouse cohort design.
-
BBox‐and‐whisker plot showing the distribution of log2‐intensity values of body weight across five groups: HFD_1‐2 m (N = 6), HFD > 6 m (N = 6), GIP (N = 7), GLP‐1 (N = 8), and GLP‐1/GIP (N = 6).
-
CVolcano plot of statistical significance against log2‐fold change between mice on > 6 months of HFD and mice on 1–2 months of HFD. Significance is controlled by FDR‐corrected P‐value and minimum log2‐fold change of 1 indicated by the blue‐dotted line, demonstrating that Saa1, Pigr, Aldob, Lap3, Enpep, and Dpp4 are significantly up‐regulated.
-
D–OBox‐and‐whisker plot showing the distribution of log2‐intensity values of statistical significantly regulated proteins across five groups. Number of replicates is defined in panel (B). The yellow line is the median, the top and the bottom of the box represent the upper and lower quartile values of the data and the whiskers represent the upper and lower limits for considering outliers (Q3+1.5*IQR, Q1‐1.5*IQR) where IQR is the interquartile range (Q3–Q1).
