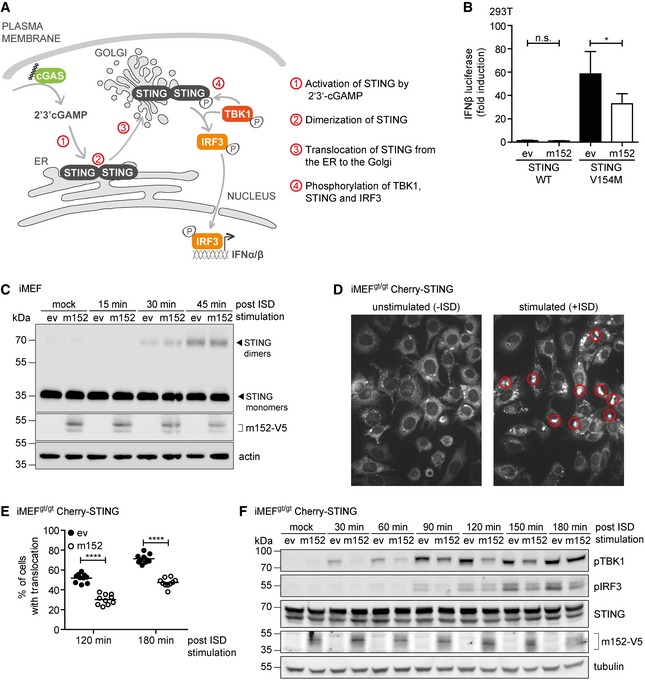
Schematic representation of the key steps in the cGAS‐STING signaling pathway.
293T cells were co‐transfected with expression plasmids for IFNβ‐Luc, pRL‐TK, and either ev or m152. Cells were further co‐transfected with either Cherry‐STING WT or the constitutively active Cherry‐STING V154M (stimulated) or with IRES‐GFP (unstimulated). Data are combined from three independent experiments and shown as mean ± SD.
iMEF stably expressing ev or m152‐V5 were stimulated with 10 μg/ml ISD for the indicated times or left unstimulated (mock). Cell lysates were analyzed by SDS–PAGE under non‐reducing conditions and subjected to IB with the specified antibodies.
Two representative still images from live cell imaging experiments with iMEFgt/gt stably expressing Cherry‐STING transfected with ISD (right panel) or left unstimulated (left panel). Red circles highlight representative translocated STING in ISD stimulated cells, which is used as an indicator of activation.
iMEFgt/gt stably expressing Cherry‐STING and either ev or m152‐V5 were stimulated with ISD. Live cell imaging was performed and STING translocation quantified 120 and 180 min post‐stimulation. Data shown are one representative of two independent experiments.
iMEFgt/gt stably expressing Cherry‐STING and V5‐tagged m152 or corresponding ev were stimulated with 5 μg/ml ISD for the indicated time or left unstimulated (mock). Lysates were subjected to IB with the specified antibodies.
Data information: IB shown in (C) and (F) are representative of three and two independent experiments, respectively. Student's
t‐test (unpaired, two‐tailed), n.s. not significant, *
P < 0.05, ****
P < 0.0001.
Source data are available online for this figure.

