Figure 5.

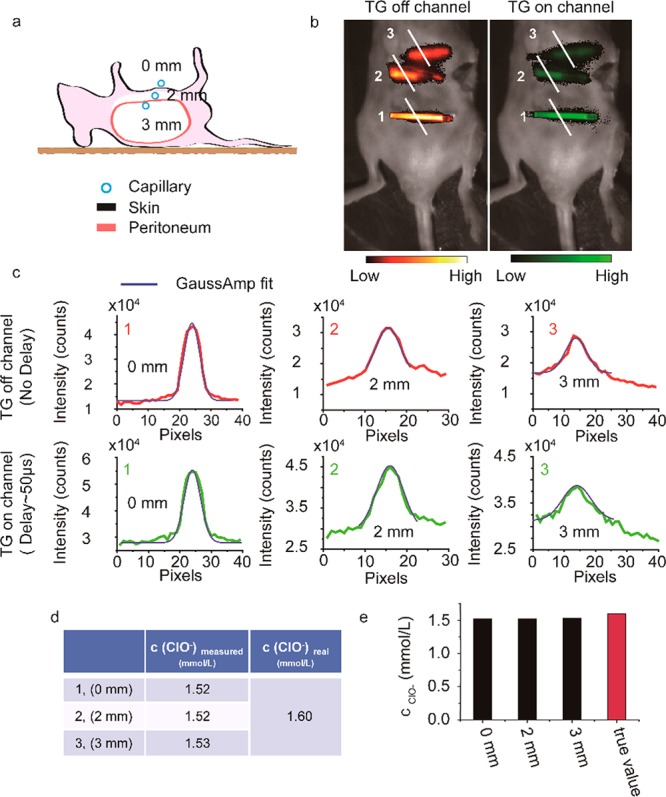
(a, b) Schematic illustration of imaging and images of capillaries filled with composite material buried in different depths of the mouse’s abdomen (gain 20, exposure time: TG on channel 10 s, TG off channel 5 s). The depths were 0, 2, and 3 mm. (c) Intensities of luminescence signals along the white line in part b. (d, e) Summary of the calculated and actual concentration of ClO–.
