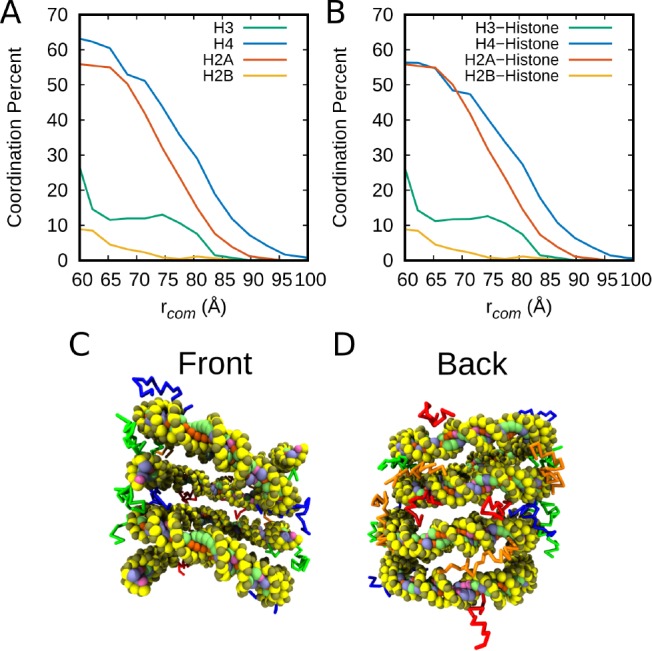
Figure 2.

Coordination analysis of the tails with regards to the “stacked” orientation. Results were calculated on the basis of sites within 1 Debye length for each snapshot, λd. (A) Percentage of interactions with the other nucleosome, including both DNA and histone contacts. (B) Fraction of contact sites that were histone contacts as compared to DNA. (C) Schematic of histone tails in the dinucleosome system from the front to highlight positioning of the H3 and H4 tails. (D) Histone tail snapshot from the back to highlight positioning of the H2A and H2B tails. The colors of the tails correspond to the graphs, and the histone core is removed for ease of viewing.
