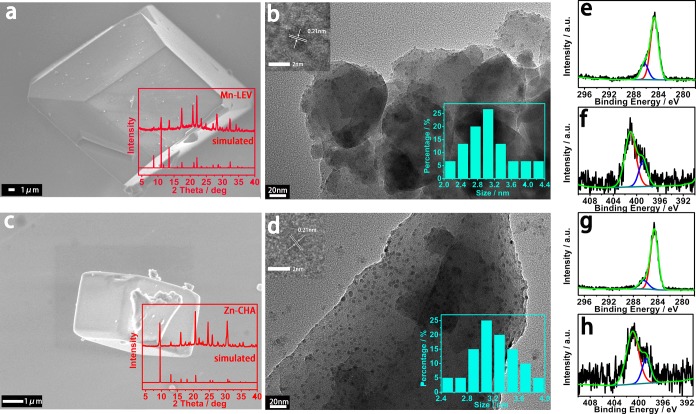
Figure 2.
SEM, TEM images, and XPS spectra of CDs@Mn-LEV and CDs@Zn-CHA composites. (a, c) SEM images of CDs@Mn-LEV and CDs@Zn-CHA (inset: XRD patterns). (b, d) TEM images of CDs@Mn-LEV and CDs@Zn-CHA, showing CDs embedded in the zeolite matrix (inset: HRTEM images of CDs with lattice spacings of 0.21 nm (left) and size distributions of CDs (right) in two composites). (e, g) C 1s XPS spectra and (f, h) N 1s XPS spectra of CDs@Mn-LEV and CDs@Zn-CHA, respectively.

