Figure 1.
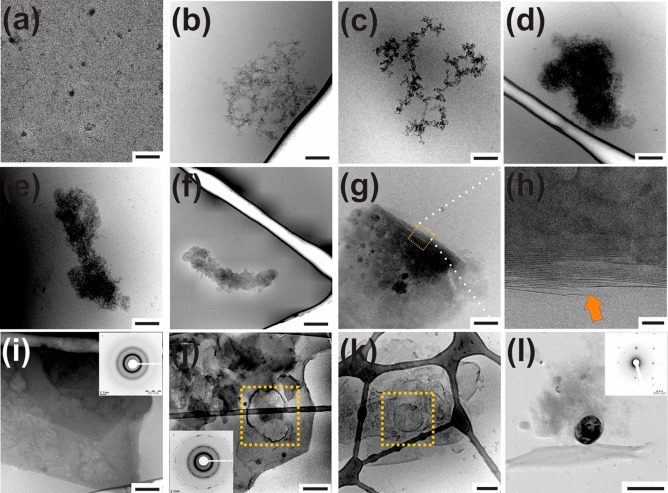
Representative cryo-TEM micrographs corresponding to the (a–f) prenucleation stages and (g–k) postnucleation stages for mineral nucleation during CTLD-controlled nucleation at pH 9.0 with protein contents of 0.1 mg/mL. Presence of organic laminae (g and h) and vesicular structures (j and k) are indicated. (l) Representative TEM image and corresponding ED pattern of a nucleated particle. Scale bars represent (a and i) 100 nm, (b–e, k, and l) 200 nm, (f and j) 0.5 μm, and (h) 10 nm.

