Figure 4.
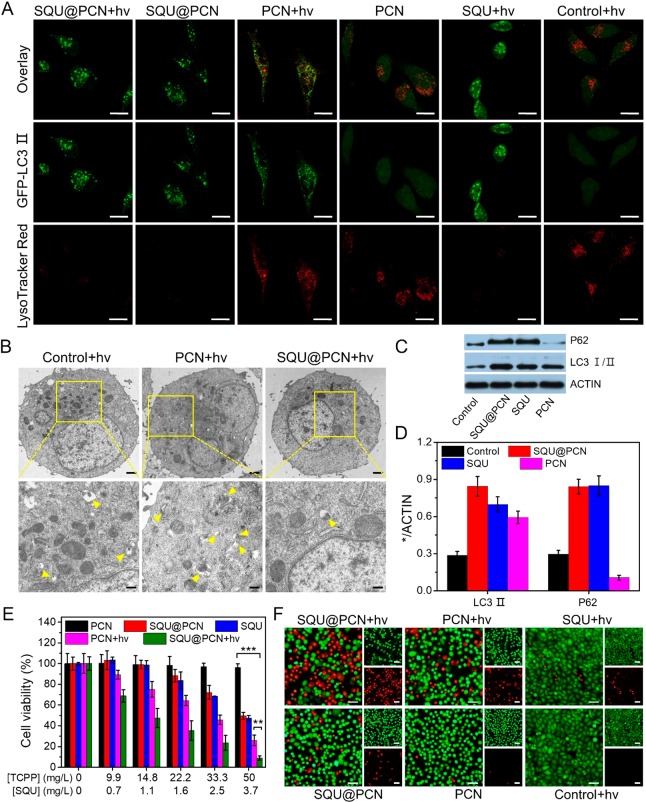
(A) Study of autolysosome formation by CLSM with GFP-LC3 HeLa cells after treatment with different samples. The lysosome was stained with LysoTracker Red. Scale bar: 20 μm. (B) Bio-TEM image of HeLa cells with different treatments under NIR irradiation. Yellow arrows refer to autolysosome. Scale bar (top panel): 10 μm. Scale bar (bottom panel): 4 μm. (C) Western blot analysis of cells with different treatments under NIR irradiation for LC3 I/II and P62 proteins and (D) corresponding gray-scale analysis result of strips. (E) In vitro cytotoxicity of different samples against HeLa cells with or without NIR irradiation. ***P < 0.001. (F) Live/dead cell staining assay with different treatments against HeLa cells. Dead cells were stained with PI (red), and live cells were stained with Calcein-AM (green). “hv” refers to light irradiation with a 660 nm laser at 30 mW/cm2 for 5 min.

