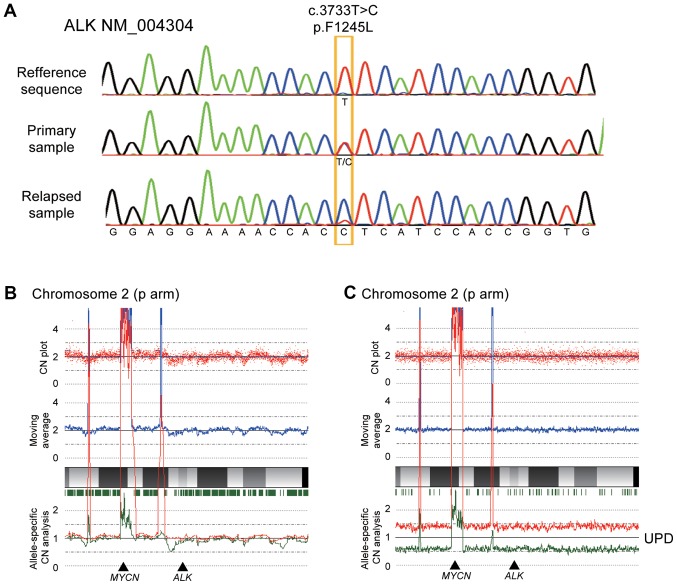
Figure 2.
(A) ALK (NM_004304) F1245L mutation status by direct sequencing at diagnosis (heterozygous) and after relapse (homozygous). Copy number analysis using a SNP array for chromosome 2 including the (B) ALK gene region in diagnosis and (C) relapse samples. Red dots at the top represent the signal from each probe (raw data), and blue line indicates the moving average of red dots. Red and green lines at the bottom represent allele-specific copy number. UPD was observed in the relapse sample. UPD, niparental disomy.

