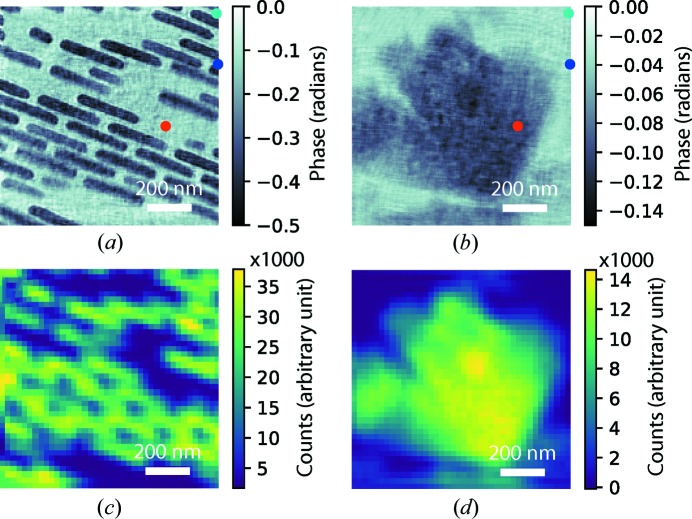
Figure 3.
The phase images from the multi-slice ptychography reconstruction on the front (a) and the rear (b) surfaces. The cyan, blue and red dots indicate the scan positions for the background, the gold zone plate structure and the nickel oxide particles, respectively. (c), (d) The simultaneously measured Au L and Ni K maps interpolated from the 1414-point Fermat spiral scan pattern onto 40 × 40 mesh grids.

