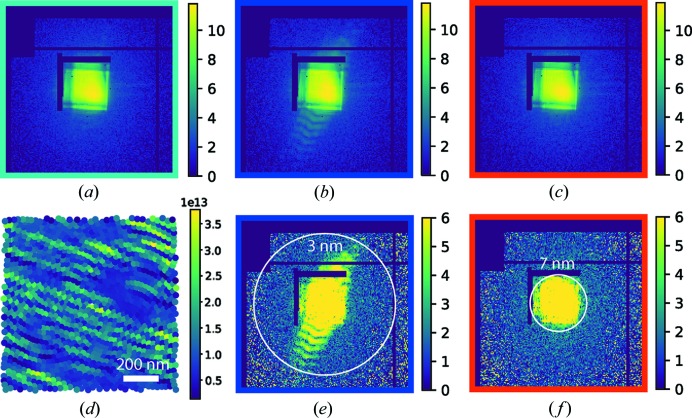
Figure 4.
Far-field diffraction patterns displayed on a logarithmic scale at locations for (a) the background, (b) the gold zone plate structure on the front surface and (c) the nickel oxide particles on the rear surface. (d) The map of the number of scattered photons from the sample mainly represents the gold zone plate structure, which confirms that the gold structure scatters more strongly than the nickel oxide particles. (e), (f) The signal distribution extends to spatial frequencies corresponding to 3 and 7 nm at the scan positions on the gold zone plate structure and the nickel oxide particles, respectively.

