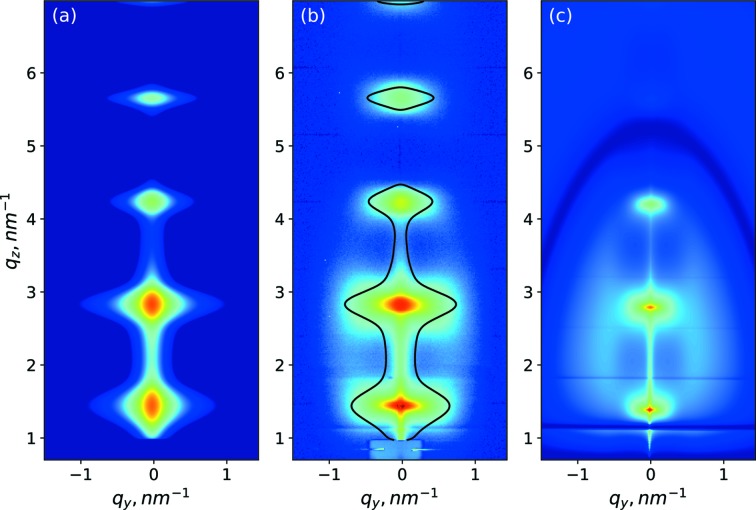
Figure 4.
GISAXS (a) simulation of scattering from interface roughness, (b) experimental data; a black solid contour separates two areas: the inner area is mostly affected by interface roughness; the outer area is mostly affected by density fluctuations. (c) Simulation of scattering from density fluctuations inside the Si layers.

