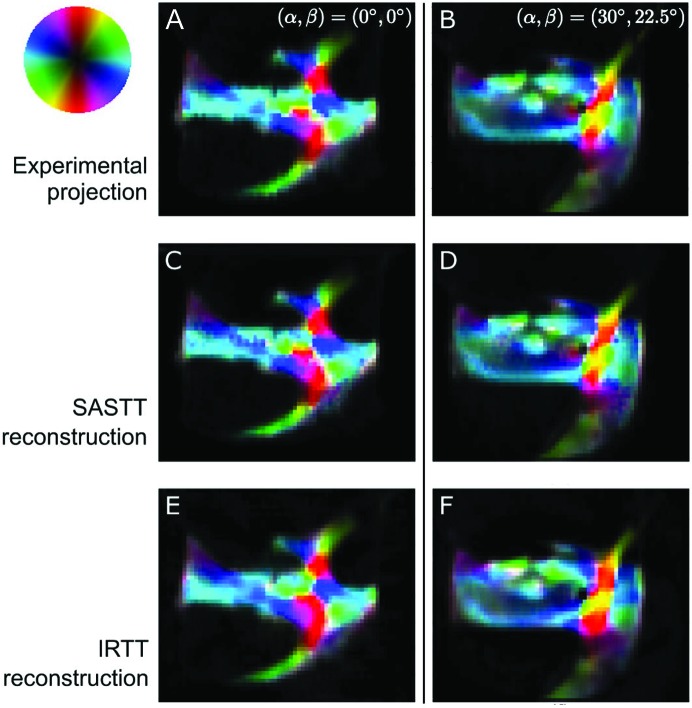
Figure 10.
Comparison of IRTT and SASTT in reconstructing anisotropy of the trabecular bone specimen, for two representative projection angles. (a)–(b) Experimental projections showing orientation-encoded maps of the bone trabecular sample. (c)–(d) SASTT-reconstructed projection displaying intensities for the same orientations. (e)–(f) IRTT-reconstructed projections. 2D nanostructure orientation can be interpreted by the color wheel.

