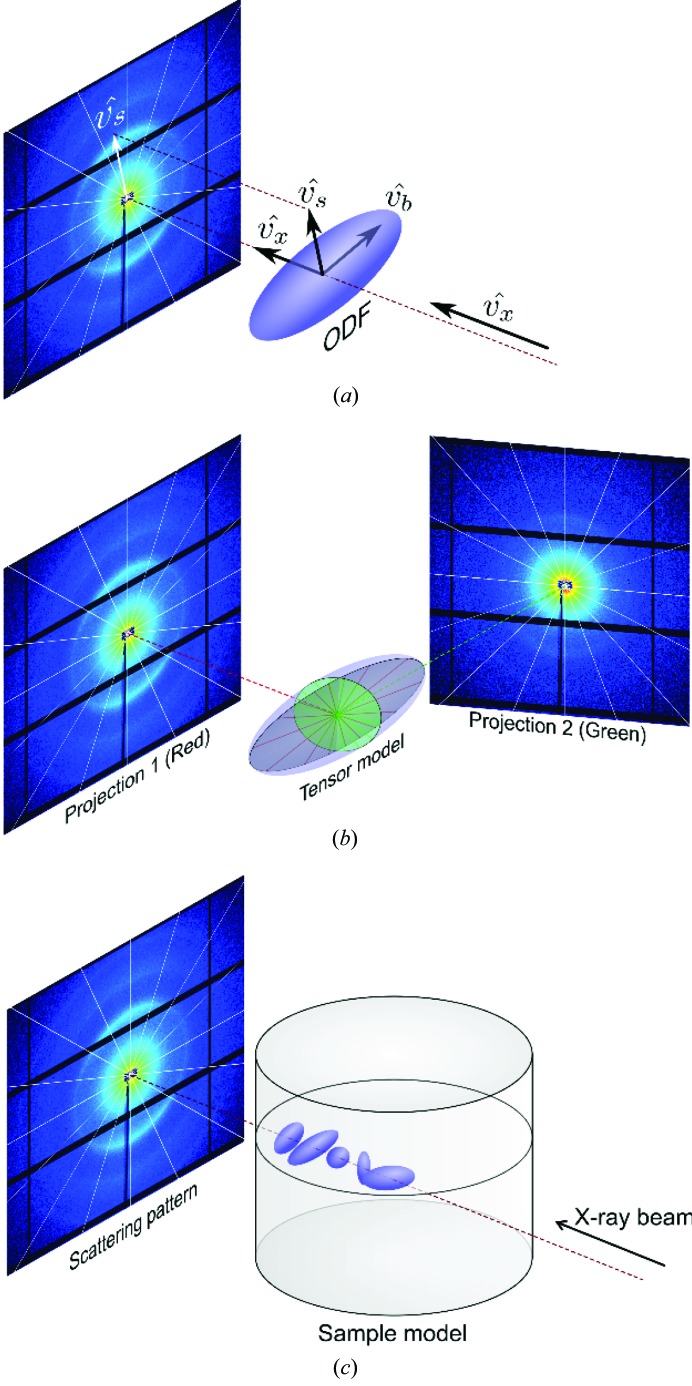
Figure 5.
Scattering based on a tensor model for sample nanostructure organization (scattering patterns shown are from the brain sample, further discussed in Section 3.3). (a) Relationship between the X-ray propagation direction  , nanostructure orientation distribution function (ODF) and measurement orientations
  . (b) The direction
  of the incident X-ray beam and the segment vectors
  on the detector plane perpendicular to the beam direction are defined by the angles α and β. The measured scattering pattern depends on the projection angles, and the measurement is described by an elliptical section of the ODF in a plane parallel to the detector plane. For a cross section for which the long ellipsoid axis is larger than its short axis, such as the red elliptical section in the ODF, there will be a highly anisotropic intensity distribution along the azimuthal direction in the detector for the corresponding q radius. On the other hand, for a section with both axes of similar length (green elliptical section) the azimuthal intensity distribution on the scattering pattern will be almost isotropic. (c) As there is one ODF tensor per voxel, the measured scattering pattern constitutes the sum of contributions of the individual ODF tensors along the path of the X-ray beam through the sample.

