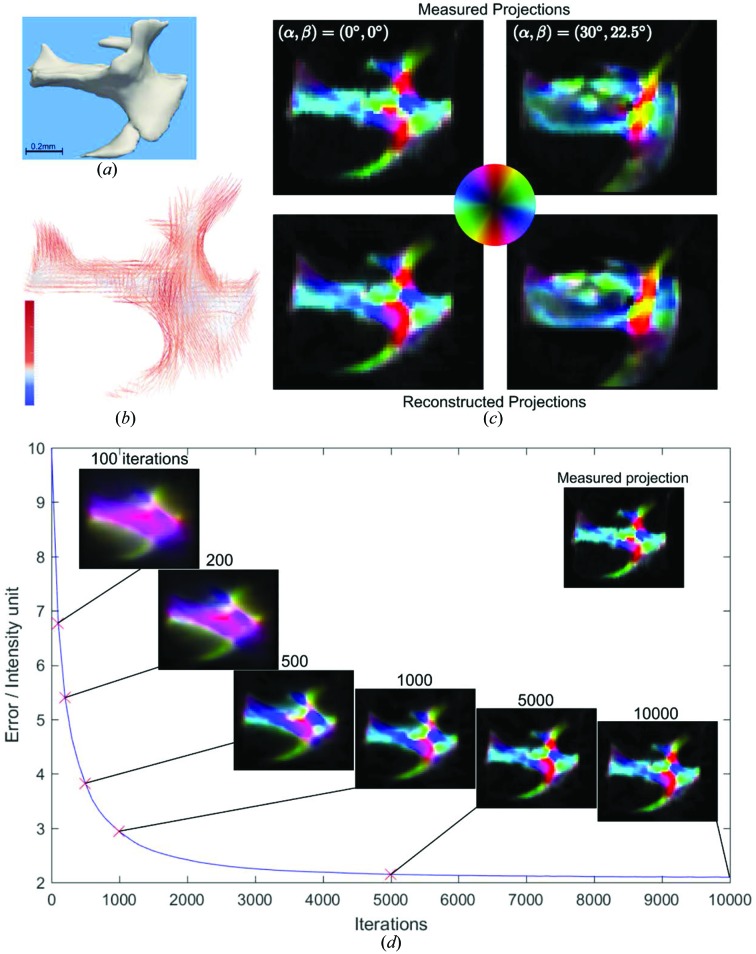
Figure 8.
IRTT reconstruction result of trabecular bone specimen from human vertebral body. (a) Volume-rendered model of 3D sample geometry. (b) 3D representation of the principal eigenvector of the ODF. The color bar indicates the corresponding eigenvalue in linear scale and arbitrary units. (c) Experimental and IRTT-derived orientation-encoded maps are shown in the upper and lower panels, respectively, for two sample orientations. Orientation is color-coded by the color wheel. (d) Error evolution with iterations and corresponding reconstructed orientation-encoded maps for (α, β) = (0°, 0°). Note the improved edge definition as the number of iterations increases. For reference, the corresponding experimental orientation-encoded map is shown as an inset.

