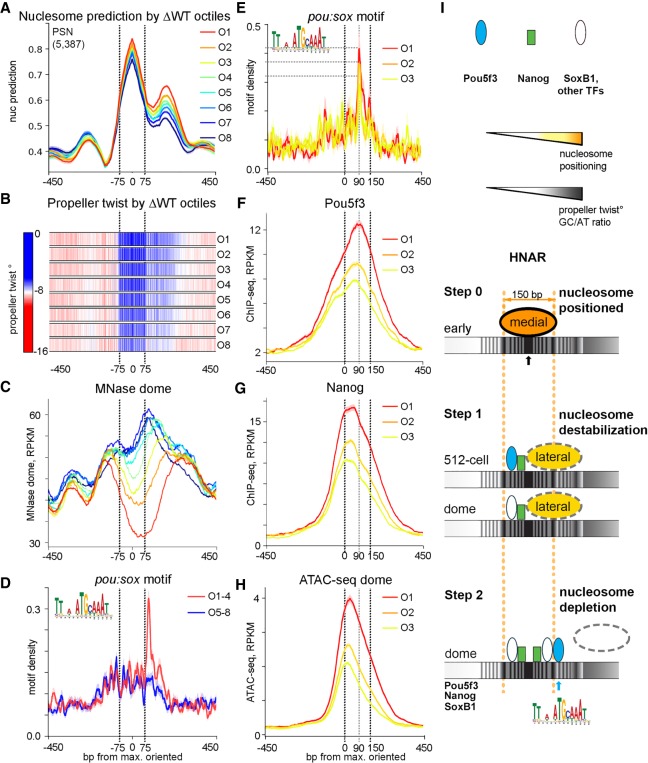
Figure 5.
Post-ZGA nucleosome depletion requires Nanog central binding and Pou5f3 binding to the +90-bp position at HNAR. PSN group regions ranked into octiles as in Figure 2, aligned on [nucmax] and oriented as in Figure 3H. Black dotted lines mark the borders of the medial nucleosome footprint in A through D and of the lateral nucleosome footprint in E through H. (A) Nucleosome prediction profiles per octile. (B) Propeller twist heat maps per octile. (C) MNase-seq (dome) per octile; note nucleosome displacement to the lateral footprint in O6 through O8. (D,E) Pou:sox motif density, base-pair motif per base-pair sequence. (D) Pou:sox motif peak at +90 bp is present in the open O1 through O4 but not in the O5 through O8 octiles. (E) Pou:sox motif abundance at the +90-bp position decreases O1 > O2 > O3. (F) Pou5f3 binds at the +90-bp position in octiles O1 through O3. (G) Nanog binds centrally in O1 through O3. (H) ATAC-seq in O1 through O3. (I) Two-step nucleosome destabilization-depletion model (see main text). Black and blue arrows show 0 (center) and +90-bp position Pou5f3 binding at HNAR.

