Figure 3.
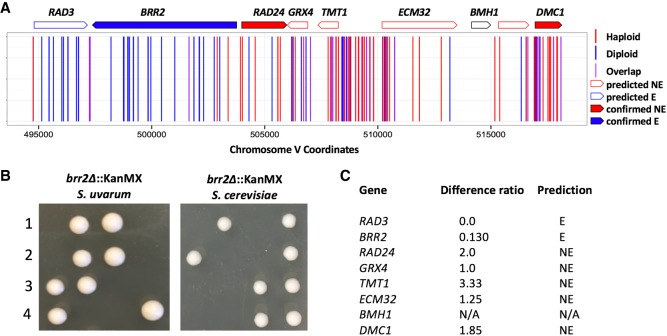
Validation of conserved essential and nonessential genes. (A) Mapped chromosomal insertion positions are plotted across Chromosome V. Haploid inserts are indicated in red; diploid inserts, in blue; and overlapping inserts, in purple. Genes indicated across the top are outlined according to predicted dispensability and filled in if confirmed. (B) Tetrad analysis of a confirmed conserved essential gene brr2Δ in S. cerevisiae and S. uvarum. Segregants containing brr2Δ alleles are inviable in both species. (C) Table indicating the insertion ratio (number of haploid inserts by the number of diploid inserts) per gene. The final column lists the predicted classification: (NE) nonessential; (E) essential; (N/A) no data.

