Figure 3.
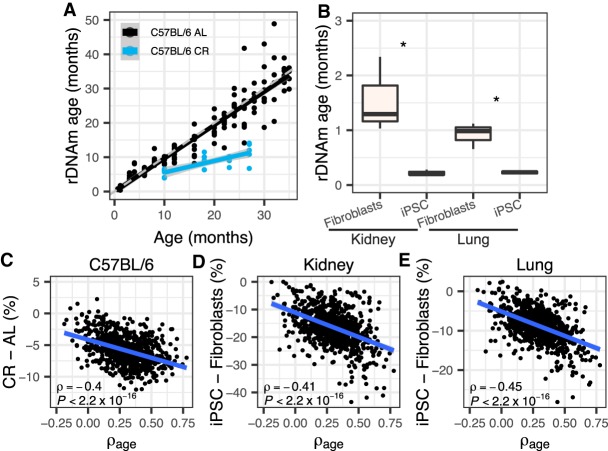
rDNA methylation and the rDNAm clock are responsive to interventions that modulate life-span. (A) C57BL/6 mice subjected to calorie restriction (CR) (starting at 14 wk old) displayed lower rDNAm age than mice fed ad libitum (AL) (one-tailed t-test of the differences between rDNAm age and chronological age, P = 1.17 × 10⁻⁹). CR mice were at four age stages (10, 18, 23, and 27 mo old, each with five samples). The theoretical line is shown in dashed gray. The black and blue lines show the regression line for the relationship between chronological and biological age of control and CR mice, respectively. (B) Derived iPSC cell lines have significantly lower rDNAm ages than their progenitor kidney and lung fibroblasts: (*) P ≤ 0.039; three samples in each group. (C–E) Correlations between the ρage of each of the 816 rDNA CpGs used to train the rDNAm clock and their change in methylation caused by interventions. (C) C57BL/6 strain 27-mo-old CR mice were considered (versus ad libitum 26-mo-old mice, i.e., the ones with the closest ages). (D,E) Derived iPSC cell lines relative to fibroblast progenitors. All samples are from the Petkovich set (Petkovich et al. 2017).

