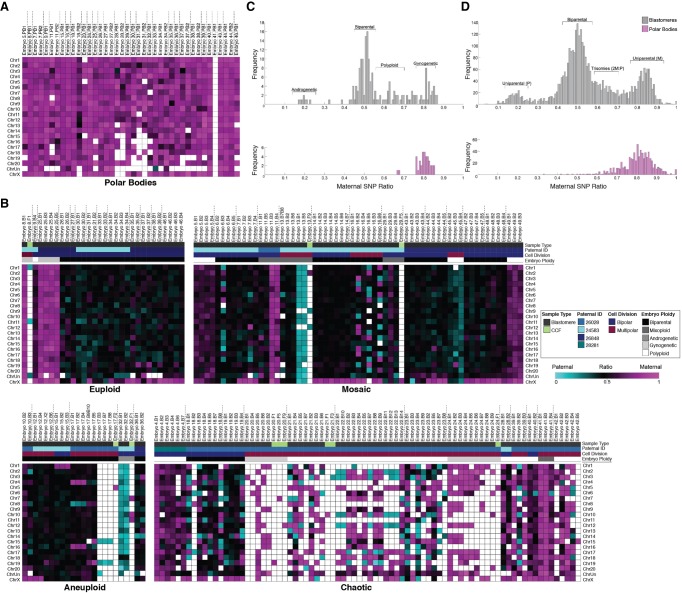
Figure 4.
SNP profiling confirms polar bodies and reveals complexity in parental contribution to aneuploidy. (A) Heat map of SNP allele parentage ratios in polar bodies confirming their maternal origins and (B) heat maps of euploid, aneuploid, mosaic, or chaotic aneuploid embryos. Each embryo is separated by vertical dotted lines. Samples were further sorted based on the paternal donor, cell type, mitotic divisions, and overall embryo ploidy. Pink, blue, and black boxes indicate maternal, paternal, and biparental inheritance, respectively. White boxes show that either the chromosome was not detected or it could not be called with high confidence. (C) Histograms showing the distribution of SNP allele ratios across blastomeres (dark gray) and polar bodies (pink) revealed that the majority of rhesus embryos were biparental, but a small proportion were androgenetic, polyploid, or gynogenetic. (D) Frequency of SNP allele ratios in histograms stratified at an individual chromosome level.

