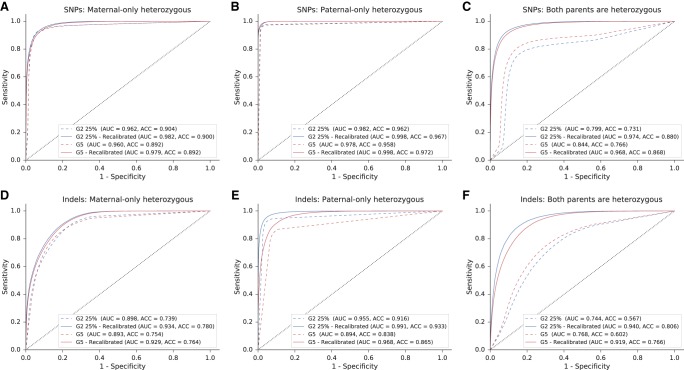
Figure 6.
Results of the machine learning–based variant recalibration step. ROC curves of the two test sets, before and after the machine learning–based variant recalibration step, are presented for three categories of either SNPs (A–C) or indels (D–F), as described. For each curve, the microaveraged area under the curve (AUC) and the total accuracy (ACC) are presented. In contrast to the results presented in Figures 3–5, no filtering was applied to parental and true fetal variants prior to this analysis.

