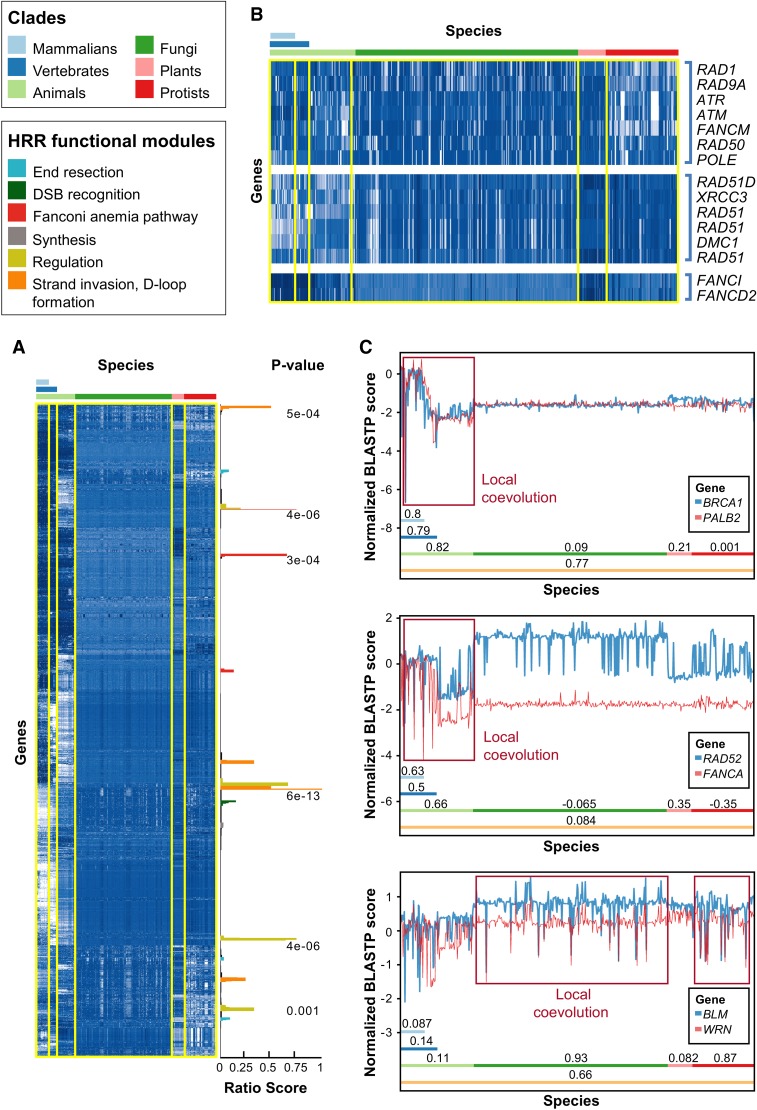
Figure 1.
Evolution of HRR proteins. (A) Normalized phylogenetic profiles (NPPs) of all human protein coding genes after hierarchical clustering and dendrogram leaf order optimization. Each row represents the NPP of a single gene across 578 eukaryotes ordered by their phylogenetic distance from Homo sapiens. The colors in the heat map indicate the relative degree of conservation between a human protein and its ortholog in a certain species (column). When zero, this means that the ortholog is conserved at the average conservation level of orthologs in the species, relative to human; negative values mean less conserved than average, and positive values mean more conserved than average (the values are in Z-scores) (for further details, see Tabach et al. 2013a). White indicates poor conservation, and dark blue indicates highly conserved genes (blue). The bars on the right side represent clusters enriched for known HRR genes, in which the score represents the fraction of known HRR genes in each cluster (Supplemental Methods), and with an FDR-adjusted P-value indicating the significance of the enrichment (hypergeometric test). The colors of the bars indicate the functional module within the HRR pathway (see legend above heat map and in Supplemental Fig. S1). (B) Examples for HRR genes clustered together. Note that only the known HRR genes in each cluster are shown. (C) Detailed view of three couples of genes that coevolved in different clades. (Top) BRCA1 and PALB2 are locally coevolved in animals but not in plants, fungi, and protists. (Middle) RAD52 and FANCA are locally coevolved only in animals. (Bottom) BLM and WRN are locally coevolved in fungi and protists but not in animals or plants. The clades are indicated by colored bars with the Pearson correlation coefficient of the two PPs within the respective clade. The y-axis indicates the NPP score as in A. Red rectangles show regions of coevolution.

