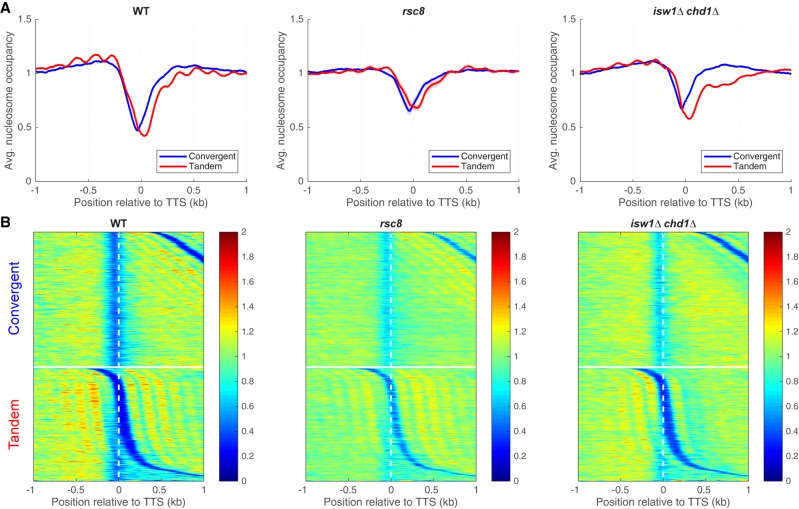
Figure 4.
Chromatin organization in the vicinity of the TTS in rsc8 and isw1Δ chd1Δ cells. (A) Nucleosome occupancy aggregate plots for convergent and tandem gene pairs aligned on the TTS of the upstream gene. MNase-seq data (for fragments of 120–160 bp) normalized to the genomic average (set at 1). (B) Heat maps for the data in A, aligned on the TTS of the upstream gene and sorted by the distance to the TSS of the downstream gene. The white horizontal line separates convergent from tandem gene pairs. Equivalent plots for the other strains are shown in Supplemental Figure S7.

