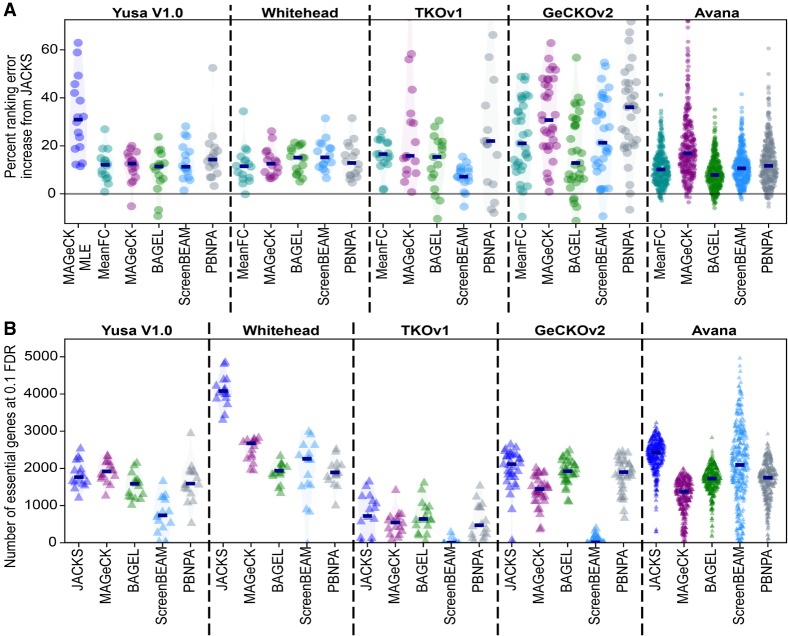
Figure 2.
JACKS outperforms existing approaches. (A) JACKS outperforms existing alternatives at distinguishing essential genes. Percentage of ranking error increase (y-axis) compared to JACKS for five to six alternative analysis methods (x-axis) on five different libraries (panels). Every marker represents one cell line or time point sample; median increase is marked with a dark blue line segment, and estimated distributions are shaded. (B) JACKS identifies more essential genes compared with existing methods. Number of essential genes identified at a 0.1 false-discovery rate (y-axis) for JACKS and alternative analysis methods (x-axis). Every marker represents one cell line or time point sample.

