Figure 3.
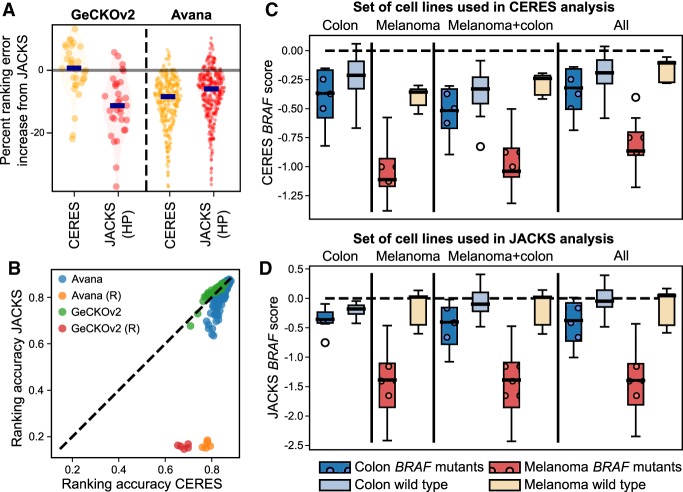
Assuming similar gene essentiality across experiments biases results. (A) Methods that assume similar gene essentialities across cell lines perform favorably compared to JACKS. Percentage of ranking error increase compared to JACKS (y-axis) for CERES (yellow) and JACKS with a hierarchical prior (HP) (red) for the GeCKOv2 and Avana libraries. Markers and shading as in Figure 2A. (B) CERES identifies essential genes from random data. Ranking accuracy of CERES (x-axis) compared to JACKS (y-axis) on cell lines (individual markers) from the Avana (blue) and GeCKOv2 (green) libraries, as well as five randomized experiments (yellow and red markers) included for comparison. Dashed line, y = x. (C) CERES’ preference for a common gene response across cell lines results in more similar scores for differentially essential genes, whereas (D) JACKS maintains differential signal between cell lines. CERES (C) and JACKS (D) gene essentiality scores for the BRAF gene in melanoma and colon cancer cell lines (colors) when processed with selections of cell lines (panels) from the Avana data set, grouped by BRAF mutation status (shading and patterns).

