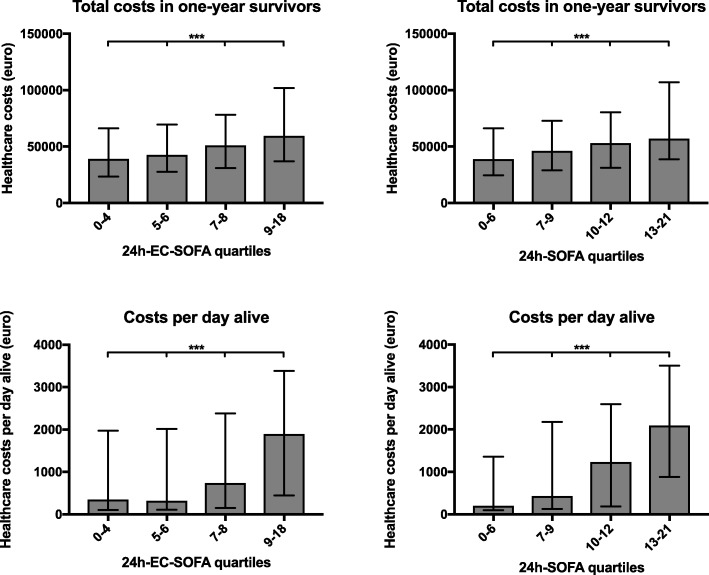
Fig. 3.
Healthcare-associated costs recorded during the first year after cardiac arrest in quartiles of 24h-EC-SOFA and 24h-SOFA scores. Upper panels: Total healthcare-associated costs in 1-year survivors in quartiles of 24h-EC-SOFA score (left) and full 24h-SOFA score including CNS sub-score (right). Lower panels: healthcare-associated costs per day alive in quartiles of the 24h-EC-SOFA score (left) and full 24h-SOFA score including CNS sub-score (right). The cost per day alive was calculated by dividing the total cost by the number of days from cardiac arrest to death. For 1-year survivors, the cost per day alive was calculated by dividing the total cost by 365 days. Median values (bars) with interquartile range (whiskers) are presented. ***P < 0.001 for the difference between the four groups (Kruskal-Wallis test)

