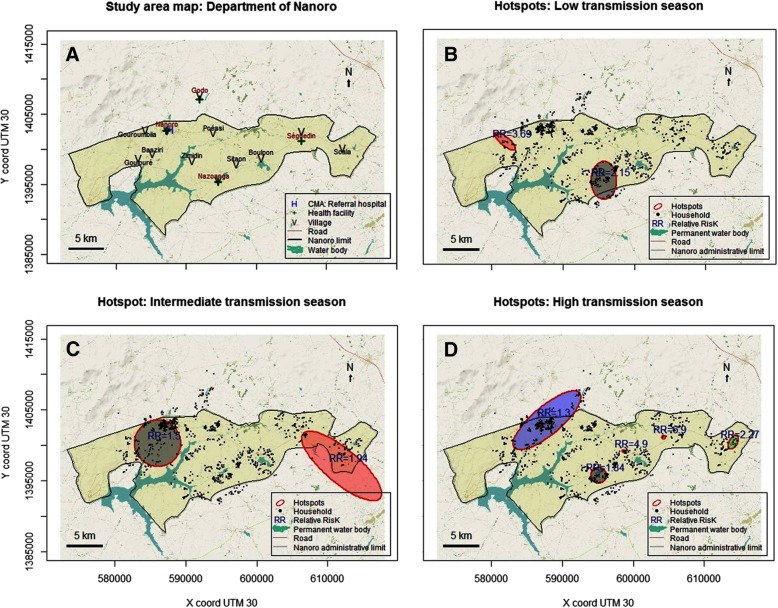
Fig. 4.
Map of Nanoro (a) with water bodies, villages and health facilities. Hotspots of cumulative weekly malaria incidence in Nanoro: High transmission period (b), Intermediate transmission period (c), Low transmission period (d). Source: Burkina Faso, Base Nationale de Découpage du territoire (BNDT, 2006); shapefile downloaded from www.maplibrary.org. The map background (raster) is captured from https://www.openstreetmap.org/#map=12/12.6228/-2.1622. Maps created by Toussaint Rouamba, 2018

