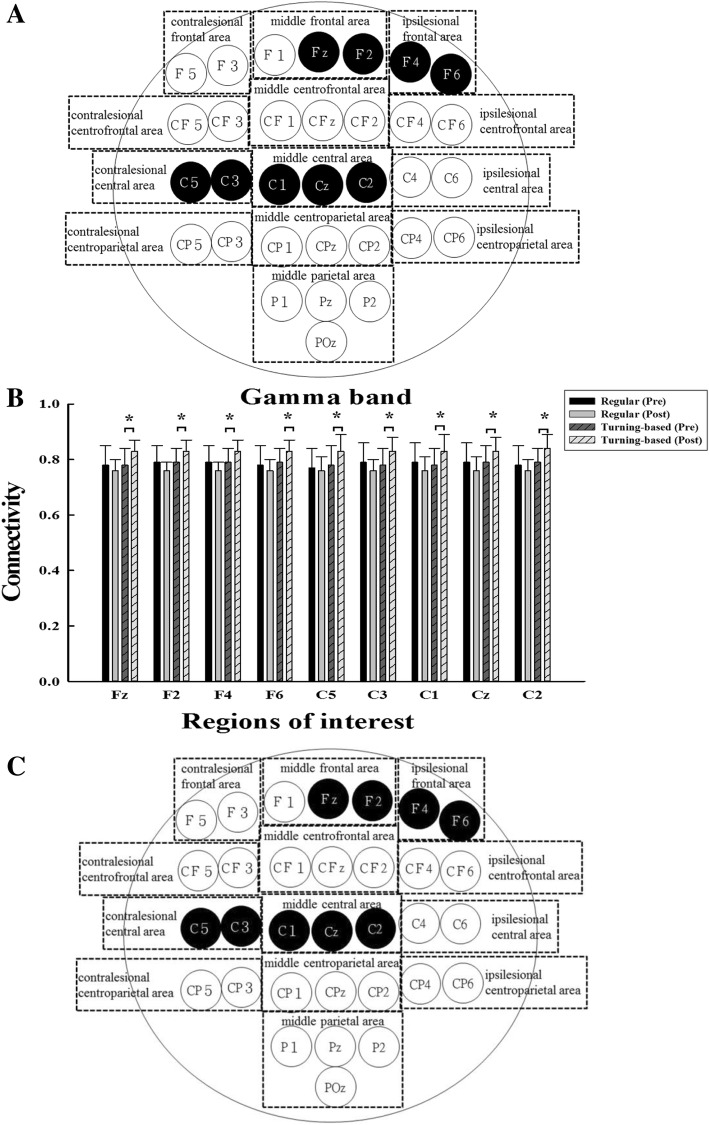
Fig. 3.
(a) Functional EEG-EMG connectivity in the gamma band. The signals were recorded during regular treadmill walking. The black circles represent the corticomuscular connectivity with significant intergroup difference. (b) The means and standard deviations of the EEG-EMG connectivity values are shown for the regions with significant intergroup differences. * denotes a significance level < 0.05 for intergroup comparisons (control vs. experimental). (c) Changes in the functional EEG-EMG connectivity in the gamma band correlate with the recovery of temporal gait asymmetry. The black circles represent the changes in the EEG-EMG pairs with significant intergroup differences that were negative correlated with the changes in the temporal asymmetry ratio. For better visualization and interpretation, the left represents the contralesional hemisphere, and the right represents the ipsilesional hemisphere

