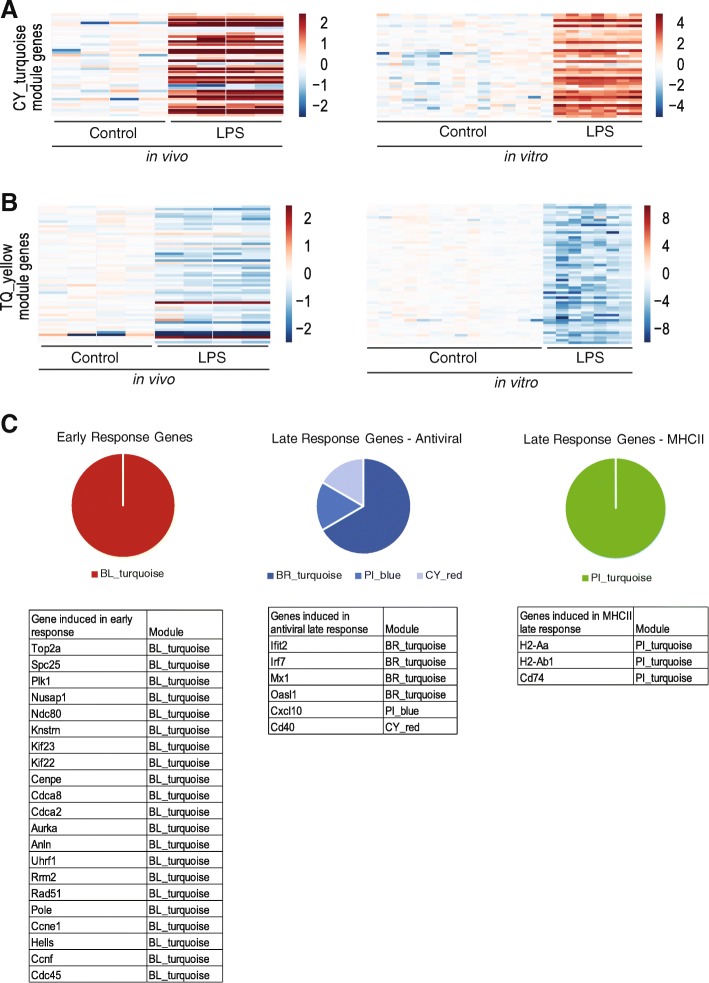
Fig. 6.
Modules derived in vitro can be observed in vivo (a-b) Representative modules upregulated [A] and downregulated [B] by LPS treatment in vivo and in vitro. Heatmaps show of differential expression for the genes in each module (log2 fold change relative to mean expression of control samples). n > =4 samples per condition. c Module membership of genes from Mathys et al., (2018) that correspond to the early-response microglia [left], late-response-interferon microglia [middle], and late-response-MHCII microglia [right]. Pie chart [top] shows the proportion of genes from each list corresponding to a given module. Tables [bottom] show the list of genes and their module membership

