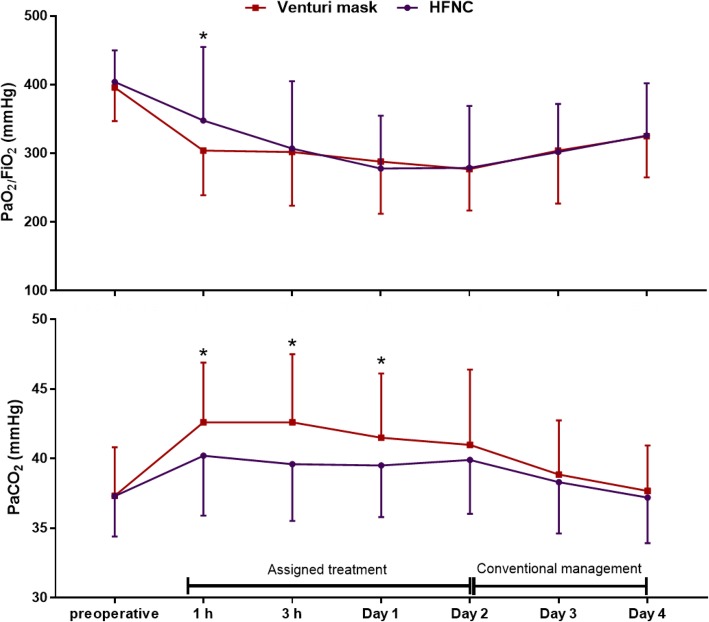
Fig. 3.
Postoperative PaO2/FiO2 ratio and PaCO2 in the two study groups. Results are expressed as means and standard deviation. No differences were detected in the PaO2/FiO2 ratio (ANOVA p = 0.92). Patients in the HFNC group showed lower PaCO2 over the entire course of the study (ANOVA p = 0.015), with a mean difference between study treatments of 1.7 mmHg [95% CI 0.3–3]. This difference was particularly evident while the assigned treatments were administered, with a mean difference between groups of 2 mmHg [95% CI 0.5–3.4] (ANOVA p = 0.009). *Indicates p < 0.05 for the comparison between HFNC and Venturi mask at the single timepoint

