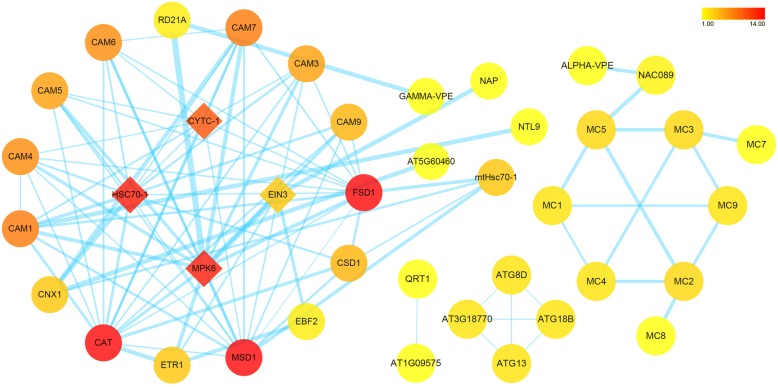
Fig. 7.
The protein-protein interaction network of the significantly DEGs involved in the nucellar PCD. The nodes represent target proteins shown by their gene names, respectively. The color band is illustrated from red to yellow in descending order of degree values. Edge size is mapped according to its corresponding parameter EdgeBetweenness with lower value to smaller size

