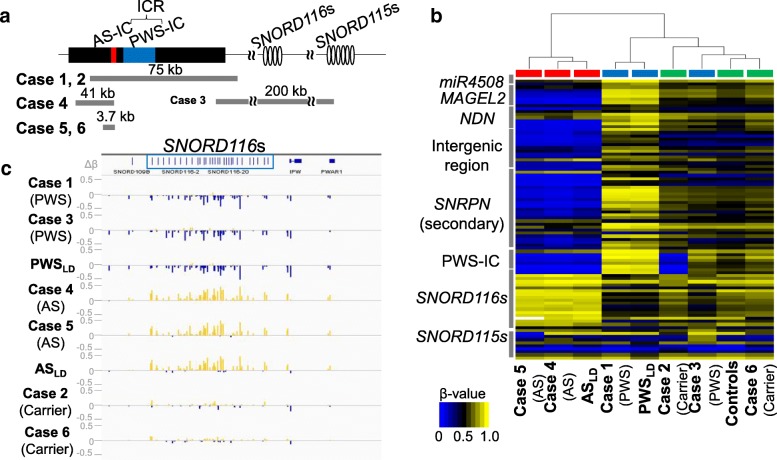
Fig. 2.
Genomic organization of the PWS/AS locus and alteration in DNA methylation of CpG sites in 15q11–13. a Summary of the loci and the approximate sizes of the deleted regions in cases 1–6. b Unsupervised hierarchical clustering and heat map of the 450k methylation data of 89 probes with |Δβ| > 0.2 and FDR p values < 0.01 between at least 1 case and controls are shown. The cases with AS phenotype are shown in red boxes, those with PWS phenotype in blue boxes, and the carriers and normal controls in green boxes. Blue and yellow colors indicate 0 and 1 methylation, respectively. The y-axis represents the names of iDMRs which had been known to be differentially methylated previously. Not all names of the iDMRs are shown. c The differences in β values (Δβ) of probes located in the SNORD116s and 115s clusters between each case and controls are shown using IGV (Integrated Genome Viewer, http://software.broadinstitute.org/software/igv/). The probes showing “hypermethylated” in cases are represented by yellow vertical bars, and those showing “hypomethylated” by blue ones. ICR, imprinting control region; IC, imprinting center; kb, kilobase

