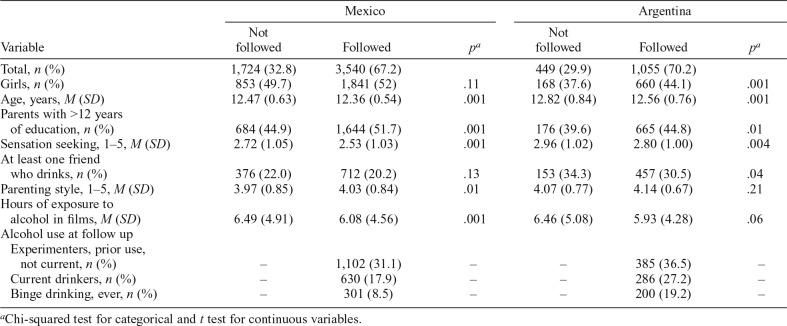
Table 1.
Characteristics of students who were and were not successfully followed
| Variable | Mexico |
Argentina |
||||
| Not followed | Followed | pa | Not followed | Followed | pa | |
| Total, n (%) | 1,724 (32.8) | 3,540 (67.2) | 449 (29.9) | 1,055 (70.2) | ||
| Girls, n (%) | 853 (49.7) | 1,841 (52) | .11 | 168 (37.6) | 660 (44.1) | .001 |
| Age, years, M (SD) | 12.47 (0.63) | 12.36 (0.54) | .001 | 12.82 (0.84) | 12.56 (0.76) | .001 |
| Parents with >12 years of education, n (%) | 684 (44.9) | 1,644 (51.7) | .001 | 176 (39.6) | 665 (44.8) | .01 |
| Sensation seeking, 1–5, M (SD) | 2.72 (1.05) | 2.53 (1.03) | .001 | 2.96 (1.02) | 2.80 (1.00) | .004 |
| At least one friend who drinks, n (%) | 376 (22.0) | 712 (20.2) | .13 | 153 (34.3) | 457 (30.5) | .04 |
| Parenting style, 1–5, M (SD) | 3.97 (0.85) | 4.03 (0.84) | .01 | 4.07 (0.77) | 4.14 (0.67) | .21 |
| Hours of exposure to alcohol in films, M (SD) | 6.49 (4.91) | 6.08 (4.56) | .001 | 6.46 (5.08) | 5.93 (4.28) | .06 |
| Alcohol use at follow up | ||||||
| Experimenters, prior use, not current, n (%) | – | 1,102 (31.1) | – | – | 385 (36.5) | – |
| Current drinkers, n (%) | – | 630 (17.9) | – | – | 286 (27.2) | – |
| Binge drinking, ever, n (%) | – | 301 (8.5) | – | – | 200 (19.2) | – |
Chi-squared test for categorical and t test for continuous variables.

