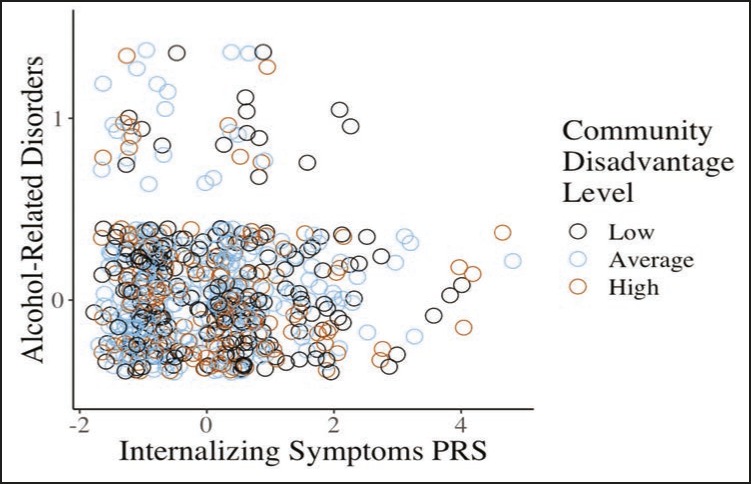
Figure 1.
Scatterplot of having alcohol-related disorders in the context of low (.5 SD below the mean), average (mean), and high (.5 SD above the mean) community disadvantage based on participants’ internalizing symptoms polygenic risk score (PRS). 0 = no alcohol abuse or dependence, 1 = alcohol abuse or dependence.

