
Table 2.
Bivariate correlations, means, standard deviations, and ns of study variables
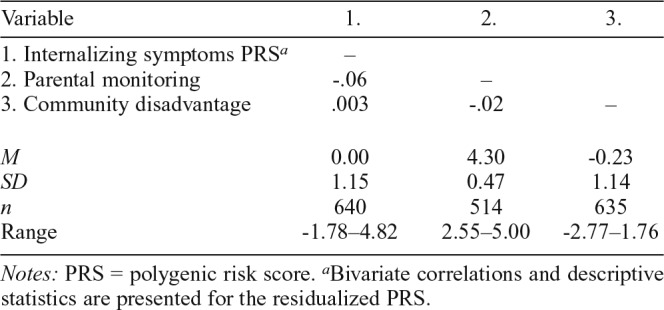
| Variable | 1. | 2. | 3. |
| 1. Internalizing symptoms PRSa | – | ||
| 2. Parental monitoring | -.06 | – | |
| 3. Community disadvantage | .003 | -.02 | – |
| M | 0.00 | 4.30 | -0.23 |
| SD | 1.15 | 0.47 | 1.14 |
| n | 640 | 514 | 635 |
| Range | -1.78–4.82 | 2.55–5.00 | -2.77–1.76 |
Notes: PRS = polygenic risk score.
a
Bivariate correlations and descriptive statistics are presented for the residualized PRS.