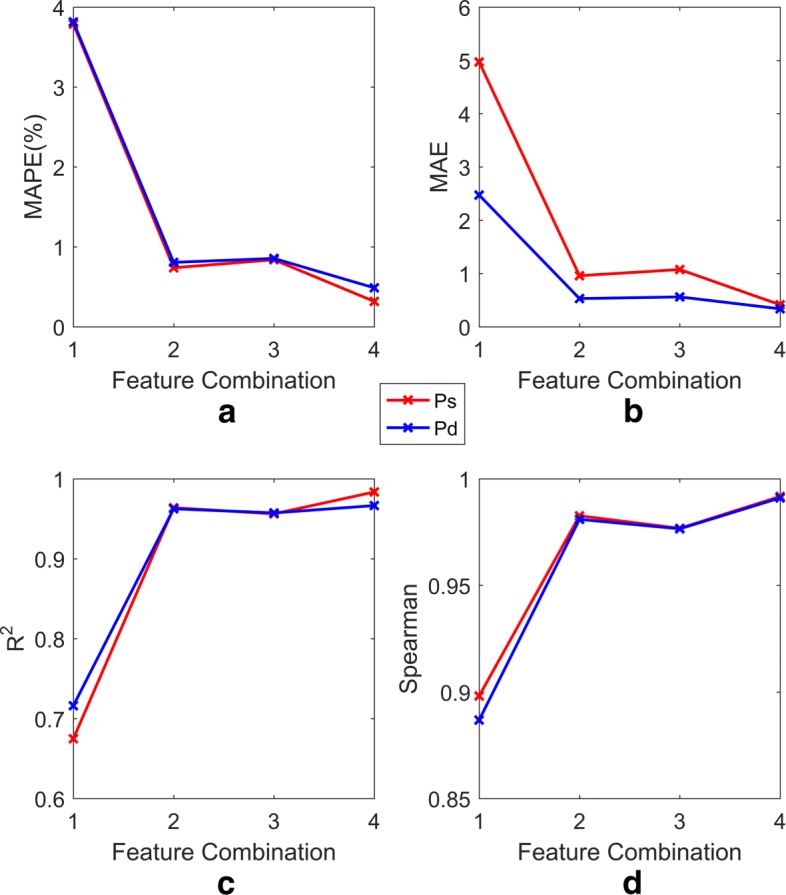
Fig. 8.

MAPE, MAE, R2, Spearman’s correlation of SVR models with 4 different feature combinations. In Fig. 8, a, b, c, and d, respectively, represent the performance of models (including Ps and Pd) in terms of MAPE, MAE, R2 and Spearman’s correlation for the feature combinations shown in Table 5. The red and blue lines represent the Ps and Pd models, respectively
