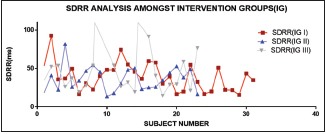
Graph 5.

Maximum peak is observed in white light showing increased variability followed by red and blue in both the graphs, i.e. SDNN and that of rMSSD. Increase in variability in these parameters (time domain HRV component) is co-related with improved life expectancy and better prognosis. Although RMSSD it is not of much signifance, it is a slow changing time domain parameter
