Figure 1.

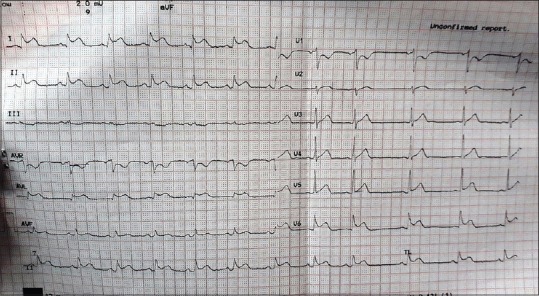
ECG showing ST elevation in II, I, aVL, V5, V6 with concavity upward and PR segment elevation in aVR and PR segment depression in other leads

ECG showing ST elevation in II, I, aVL, V5, V6 with concavity upward and PR segment elevation in aVR and PR segment depression in other leads