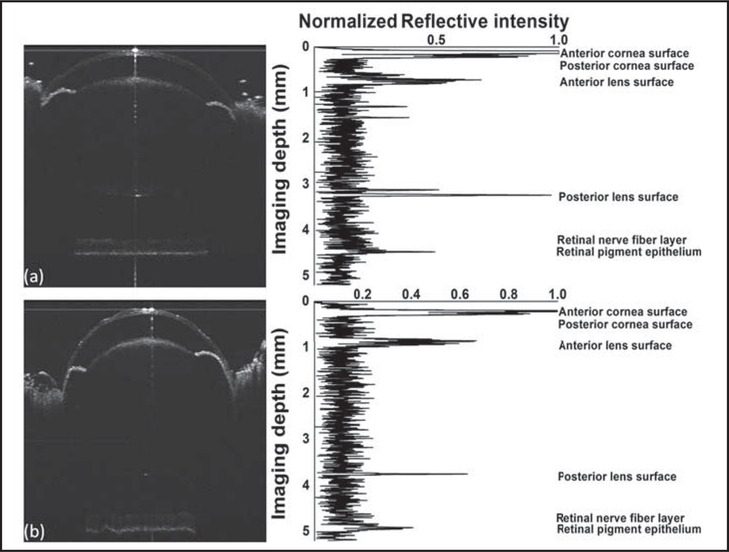
Figure.
Sample spectral-domain optical coherence tomography images and the corresponding intensity signal of the central A-line of a mouse eye at (A) 28 and (B) 82 days old. Axial length: from anterior corneal surface to the retinal pigment epithelium. Corneal thickness: from anterior corneal surface to posterior corneal surface. Anterior chamber depth: from posterior corneal surface to anterior lens surface. Lens thickness: from anterior lens surface to posterior lens surface. Vitreous chamber depth: from posterior lens surface to inner limiting membrane. Retinal thickness: from inner limiting membrane to retinal pigment epithelium

