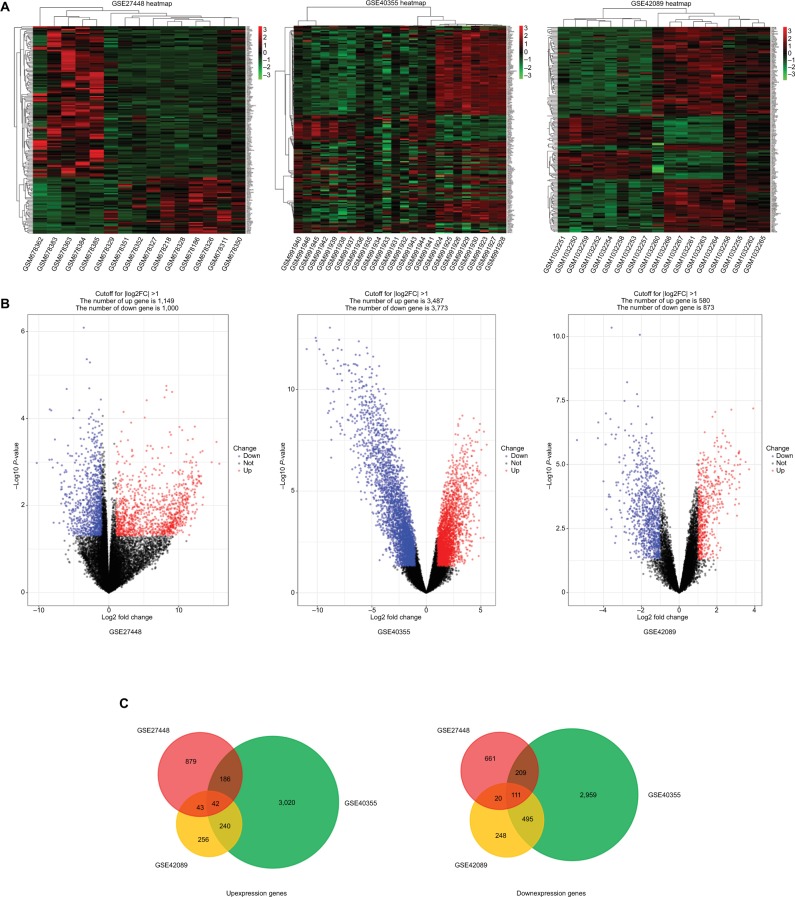
Figure 1.
The analysis result of GSE27448, GSE40355, and GSE42089.
Notes: (A) Heatmap overview of the differentially expressed genes. Red: upregulation; green: downregulation. (B) Volcano plot of the differentially expressed genes. (C) The result of Venn diagram. DEGs were divided into two groups: upexpression and downexpression. Different color areas meant different datasets and the cross areas represented the commonly changed DEGs.
Abbreviation: DEGs, differentially expressed genes.

