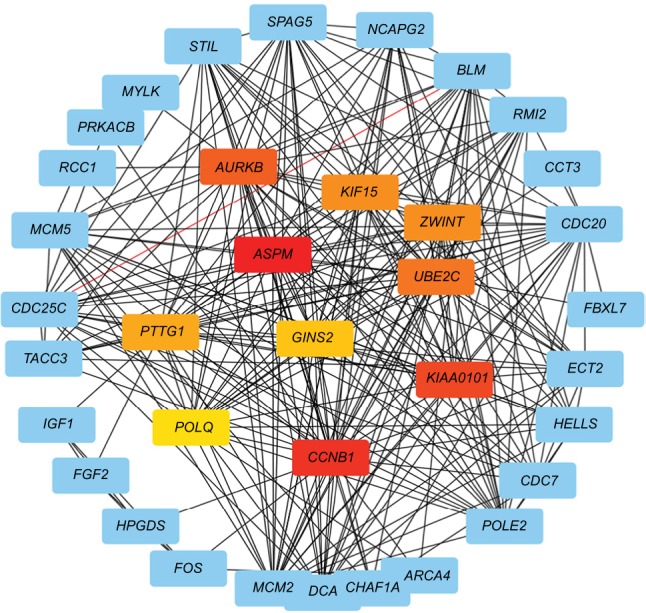
Figure 3.

Protein–protein interaction networks.
Notes: Upexpression genes were analyzed and constructed a network. Red nodes: first-level hub genes; orange nodes: second-level hub genes; yellow nodes: third-level hub genes.

Protein–protein interaction networks.
Notes: Upexpression genes were analyzed and constructed a network. Red nodes: first-level hub genes; orange nodes: second-level hub genes; yellow nodes: third-level hub genes.