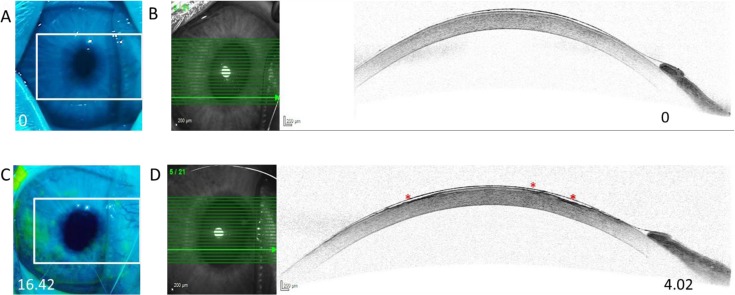
Figure 2.
Corneal fluorescein staining and AS-SD-OCT imaging in a short-term dry eye rabbit model. (A), (C) Representative images of corneal fluorescein staining of rabbit corneas prior to (A) and following (C) 140 minutes desiccation. The numbers at the bottom of the pictures represent percentage of fluorescein corneal stained area as determined by ImageJ for each eye. (B), (D) AS-SD-OCT imaging of the eyes shown in panels (A), (B), respectively. The numbers at the bottom of the pictures represent the PEEA as determined by AS-SD-OCT for each eye. (D) Epithelial erosions are marked with red asterisks.

