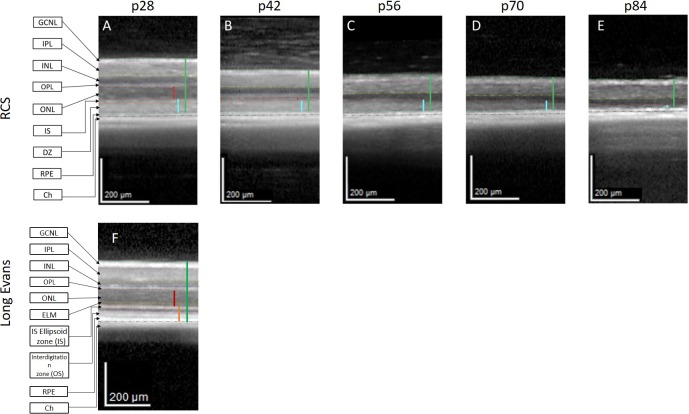
Figure 3.
Identification of photoreceptor loss and reduction in DZ layer thickness in RCS rats by SD-OCT. (A–E) SD-OCT scans of the central retina area in a single-representative RCS rat at different ages (p28–p84). (F) A representative SD-OCT scan of WT Long Evans rat at p28. Vertical lines highlight the ONL (red) and total retina (green). The turquoise vertical lines indicate the DZ in the RCS rat (A–E). The orange vertical line indicates the photoreceptor outer segment layers in Long Evans rats (F). Horizontal lines highlight the GCNL, ganglion nerve fiber layer (green-pink); IPL, inner plexiform layer (pink-yellow); INL, inner nuclear layer (yellow-blue); OPL, outer plexiform layer (blue-magenta); ONL (magenta-red); IS, inner segments (red-orange); DZ (orange-turquoise); RPE (turquoise-black); Ch, Choroid.

