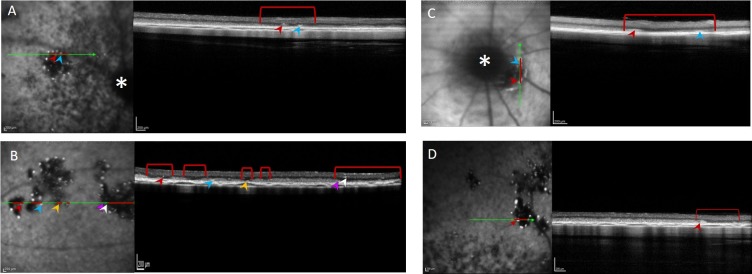
Figure 5.
BL-FAF imaging and corresponding SD-OCT scans of well-defined hypofluorescent lesions and hyperfluorescent foci. Lesions detected in animals at p56 (A), p70 (B, C), and p84 (D). The green arrows indicate the position from which the SD-OCT scans on the right were taken. Red lines highlight the lesion cross-sections. The optic disc is marked with a white asterisk in (A, C). Hypofluorescent foci are highlighted by colored arrowheads.

