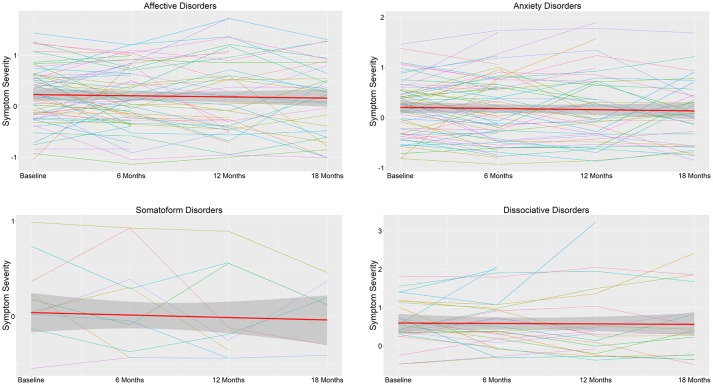
Figure 2.
Symptom severity during 18 months in outpatients and daycare patients (N = 155) by DSM-IV diagnostic category. The thick red line represents the mean score across symptoms belonging to this diagnostic category and the associated ribbon the standard deviation. The colored thin lines represent the mean score across subjects of each symptom belonging to this diagnostic category. Higher scores represent higher severity.

