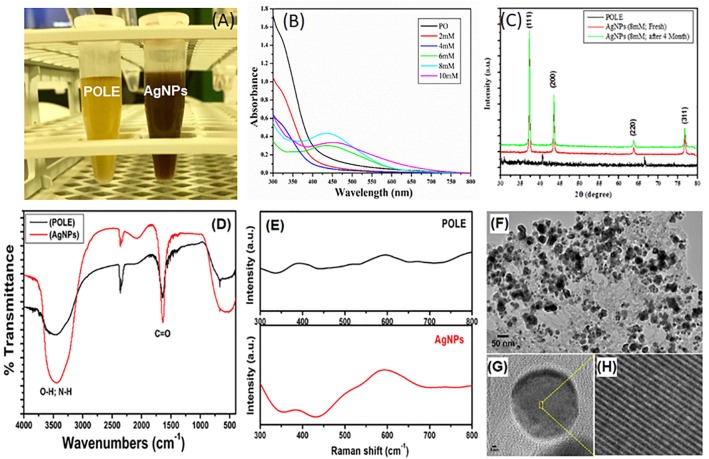
FIGURE 1.
Characterization of POLE-capped silver nanoparticles (AgNPs). (A) Different concentrations of AgNO3 (2, 4, 6, 8, and 10 mM) were used to synthesize the AgNPs. 5 mL of each leaf extract (50 mg/mL) and AgNO3 solution (8 mM), gave best yield of silver nanoparticles by using microwave irradiation method. The resulting solution turned out to the characteristic brown color of the AgNPs in 90 min. (B) The absorption spectra of the synthesized nanoparticles were recorded in 300–800 nm wavelength range. The characteristic absorption peak of AgNPs is centered on 430 ± 20 nm. (C) The XRD data show diffraction peaks at 2θ = 37.2, 43.4°, 63.5, and 76.6° corresponding to the [111], [200], [220], and [311] planes of silver, respectively. (D) FT-IR spectra of plant extract (POLE) and AgNPs. The characteristic peak at 1636 cm-1 can be attributed to the C = O (carbonyl) groups. (E) Surface enhanced Raman spectroscopy (SERS), spectra displayed the characteristic signals of POLE with the enhanced intensity for AgNPs indicating the capping of POLE on the surface of AgNPs. (F) TEM image of POLE-capped AgNPs, (G,H) HRTEM (high-resolution transmission electron microscopy) images of POLE-capped AgNPs, clearly demonstrated the stability of the particles even after a period of 4 months.

